Spring 2023
Articles in this issue:
- Purdue University and the U.S. Forest Service Announce the New and Improved Alien Forest Pest Explorer Interactive Web Tool
- Populations Of Bacteria and Fungi Vary with Season and Tree Species
- Femelschlag & Fire: Oak Regeneration in Southern Indiana
- An Update on Economic Impacts of Indiana’s Hardwood Industries
- Methods to Detect Forest Carbon
- Perceptions of Land Managers Towards Using Hybrid and Genetically Modified Trees
- Grant will Fund Family Forest Carbon Program in Nine States
- The Indiana Forest Product Price Report: History and Outlook
- A Vision for Digital Forestry
- Paying Your Respects
- Lawson Wins National Award – WOC STEM
- Dr. Shaneka Lawson Awarded the 2022 Presidential Safety Award
- Janis Gosewehr Retires
- White Oak Initiative Introduces the Landowners for Oaks Series
- Chestnut Oak Decline in Southern Indiana
Purdue University and the U.S. Forest Service Announce the New and Improved Alien Forest Pest Explorer Interactive Web Tool
The user-friendly dashboard combines information from multiple sources to show the impact of different forest insects and diseases, and the potential for further damage. The interactive and customizable dashboards are the first to overlay this pest data with related data about the status and health of the host tree species in the forest, said Songlin Fei, the Dean’s Remote Sensing Chair and professor of Forestry and Natural Resources in Purdue’s College of Agriculture, who led the project.
“We want to better understand the relationship between pests and tree hosts, as well as assess the vulnerability of our forests, so that we can make the best decisions to preserve and protect them,” said Fei who leads Purdue’s Digital Forestry Initiative. “This was designed for everyone, not only for the professionals. Pest and disease prevention begins in your backyard. We want to put this tool in the hands of anyone who cares for trees so they understand what pests they may face, how to identify them and how to protect their trees and forests.”’
Fei collaborated with Nicole Kong, associate professor of geographic information systems at Purdue, to organize the data, and design and develop the tool, which Purdue hosts.
“With the COVID pandemic, we all became much more accustomed to using dashboards and realized the empowerment of being able to easily find information and trends specific to our area,” said Kong, who also is a part of Purdue’s Digital Forestry Initiative and associate dean for research in Purdue University Libraries and School of Information Studies. “One can think of this as like a COVID dashboard for forest health and pest outbreaks. We worked to visualize the data in the most useful and intuitive way.”
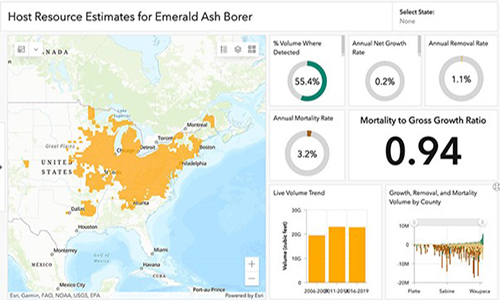
The Alien Forest Pest Explorer, or AFPE, offers maps of pest species distributions; the growth, mortality and removal rates of host species; as well as trends in host abundance and information about the pests. The annually updated data has resolution to the county level.
The dashboard and its database of information are critical to forest health protection, said Tracy Tophooven, the acting station director of the U.S. Department of Agriculture Forest Service Northern Research Station.
“In the past few centuries, hundreds of invasive insects have been introduced to the United States through a variety of means,” Tophooven said. “This tool integrates the Northern Research Station’s critical invasive species research with forest inventory and analysis data to enable users to view county-level data to meet local challenges posed by invasive insects.”
Experts from the USDA Forest Service, including Randall Morin, research forester; Andrew Liebhold, research entomologist; and Susan Crocker, research forester, collaborated on the project.
Information featured in the dashboard includes data from the team’s research into the 16 most damaging pest species and a paper Fei co-authored with Morin and Liebhold, published in the Proceedings of the National Academy of Sciences, as well as data from the Forest Service’s Forest Inventory and Analysis Program Database.
“The AFPE integrates two critical data sets and makes them available online with custom mapping options,” Morin said. “A user can quickly get information about the range of invasive forest pests and their hosts in the forests of the United States. Before the AFPE, this type of information required accessing and downloading multiple datasets and having to knowledge and tools to combine them correctly.”
The AFPE tool is dynamic and customizable. An overview video is available here.
“One can zoom in or out and even draw an outline around their area of interest and only see information from within that boundary,” Kong said. “In addition, users can search by pest, for example, the emerald ash borer, to see where it is across the U.S., how much forest volume has been lost since it arrived in an area or the volume of host trees in a vulnerable area not yet infested.”
One telling piece of information the tool illustrates is forest mortality, Fei said.
“Our forests are critical to environmental health,” he said. “Our forests are a huge carbon sink for emissions, but when a tree dies, that carbon is released. Some of the most damaging pest species are killing off trees at a rate equivalent to putting millions of more cars on the street annually, in terms of carbon emissions. We need to track this and pay attention to how things are trending. It is much cheaper and easier to maintain a forest than to try to rebuild one.”
The Alien Forest Pest Explorer database is maintained by Purdue, the U.S. Forest Service Northern Research Station, the U.S. Forest Service Forest Health Protection and the Forest Health Assessment and Applied Sciences team. The project also receives partial funding from the National Science Foundation.
Purdue’s College of Agriculture and the Forest Service have a history of successful collaboration, including a joint national level invasive plant project and a national level forest biomass and carbon project.
Writer: Elizabeth K. Gardner; 765-441-2024; ekgardner@purdue.edu
Sources: Songlin Fei, sfei@purdue.edu
Nicole Kong, kongn@purdue.edu
Randall Morin, randall.s.morin@usda.gov
Agricultural Communications: 765-494-8415;
Maureen Manier, Department Head, mmanier@purdue.edu
Agriculture News Page
Populations Of Bacteria and Fungi Vary with Season and Tree Species
By Dr. Shaneka Lawson, USDA Forest Service, Research Plant Physiologist
Abstract
Interactions between above- and below-ground components within forest plantations in the Central Hardwoods Region (CHR) have received limited research attention. Soil microbes are essential to forest ecosystems and play major roles in many ecosystem functions including nutrient cycling and soil organic matter (SOM) decomposition.
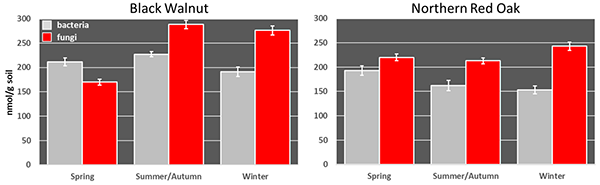
Dr. Shaneka Lawson is working with collaborators at North Carolina State University and Oxford University to evaluate differences in bacterial and fungal species composition in black walnut and Northern red oak monocultures. Thus far, significant seasonal differences have been noted in both microbial composition and overall microbial biomass between these two species across three different sites each. Seasonal changes in resource availability, which plants drive via below-ground carbon allocation, nutrient uptake, and litterfall, also affect soil microbial community composition.
There are more analyses to conduct but it appears as if additional drivers are influencing overall microbial biomass and leading to differing microbial respiration rates for black walnut and Northern red oak. A look at the variance between bacteria and fungal populations (Figure 1) hints that additional activities, occurring below ground, may contribute to the resulting growth differences among tree plantations.
Femelschlag & Fire: Oak Regeneration in Southern Indiana
By Molly Peige Barrett, M.S. Student and Mike Saunders, Associate Professor of Ecology and Natural Resources
The future of oak forests is under threat since new generations of oak are failing to regenerate and recruit into the overstory. This leads to unsustainable and unhealthy forests, since there is not enough new oak to replace mature oaks that die naturally or are harvested for timber. If this trend continues, Indiana will lose critical wildlife habitat and valuable timber.
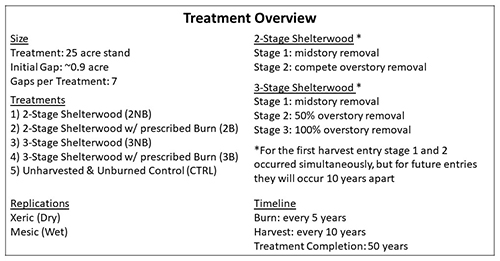
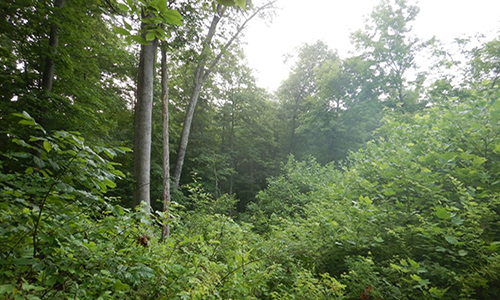
Foresters and landowners need to get creative with their harvest plans to regenerate oak. Selection and light overstory thinning do not provide enough light for oak regeneration; high levels of overstory removal create conditions too competitive for oak regeneration. The solution is an intermediate cutting where oak regeneration has enough light to grow, yet there is limited competition from fast-growing species. One such solution may be use of both Femelschlag harvests and prescribed burns in hopes of finding an ideal competitive environment for oak to succeed.
The German Femelschlag, or expanding group shelterwood, promotes regeneration of species with diverse shade tolerances. The system uses initial gaps that expand with subsequent harvests. A midstory removal buffer surrounds each gap and is harvested in the next entry. Ideally, light from the gap will filter into the midstory removal buffer creating an intermediate light environment. Oak regeneration should be able to take advantage of this intermediate light, slowly growing and storing energy in their root systems, without the threat of being overtopped by competitive, fast-growing, light-loving species.
Multiple applications of prescribed fire have also been shown to encourage oak regeneration, since oaks are more able to sprout after fire and utilize the energy stored in their roots than many of their competitors. This gives oaks an advantage over other species that are fire susceptible and allows top-killed oaks to grow to larger sizes after a burn.
Five unique treatments combinations of Femelschlag harvests and prescribed burns were designed for this study, which began in 2014 at Naval Support Activity (NSA) Crane in southern Indiana. These treatments were replicated on both northerly-facing mesic (wet) sites and southerly-facing xeric (dry) sites (specifics in Figure 1). Regeneration surveys were conducted pre-treatment, 2 years post-treatment (2016 & 2017), and 5- or 6-years post treatment (2020).
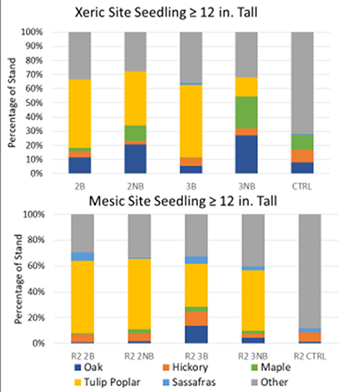
Here we report on the 2020 survey. Tulip poplar still dominated the gaps after 5-6 years, and the treatments overall, limiting oak regeneration across each site (Figure 2). The xeric site still had higher amounts of oak regeneration and more competitive oaks than the mesic site (Figure 3).
So far, there is no significant difference among Femelschlag treatments for oak regeneration. Over time, treatment areas have become more diverse, as non-focal species (“Other” in Figure 2) have increased in proportion of regeneration from less than 10% to over 30% of trees.
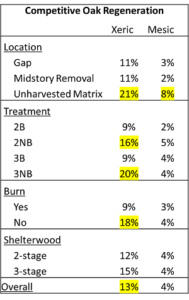
The most competitive oak regeneration was found in the unharvested forest matrix areas beyond the midstory removal buffer for both xeric and mesic sites (Figure 3). Overall, oak regeneration was higher in unharvested areas within the treated sites than within the unharvested control site, suggesting that increased light from nearby gaps may have resulted in a positive response of regeneration (Figure 2).
Treatments not receiving a prescribed burn had higher amounts of oak regeneration and were more likely to have competitive oaks than burned treatments after five years (Figure 3), suggesting the benefit of a single fire seen after two years was short-lived. Other research has also shown that multiple burns, executed frequently, are needed for a lasting, positive impact on oak regeneration.
In summary, the regeneration surveys conducted in 2016 and 2017 showed promising results and 2020 regeneration surveys still show potential for treatment areas. However, the oak regeneration response is weakening, suggesting that oak regeneration still has a chance for failure if treatments cease. Future regeneration surveys following future treatments will be essential to see if Femelschlag harvests are a viable strategy for increasing competitive oak regeneration in Indiana or elsewhere (see links to studies in North Carolina and Virginia below).
Interested in more? Check out these additional resources!
German Femelschlag Harvests Hold Promise for Oak Regeneration in Indiana – June 2018 HTIRC Newsletter
By Skye Greenler and Dr. Mike Saunders
Introducing Femelschlag: Will a German Forestry Practice Bring Oaks Back to Pisgah National Forest?
By Debbie Crane, The Nature Conservancy
Fifteen Minutes in the Forest: Femelschlag Update & Hardwood Forest Habitat Initiative
By Virginia Forest Landowner Education Program
FNR Alumni Keeps History Afloat
By Wendy Mayer
An Update on Economic Impacts of Indiana’s Hardwood Industries
By Dhruba Burlakoti, M.S. Student, Eva Haviarova, Professor of Wood Products Engineering, Mo Zhou, Associate Professor of Forest Economics and Management
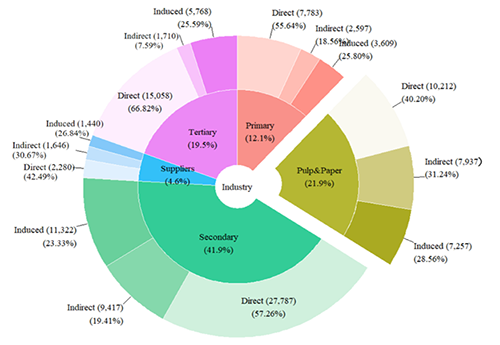
Hardwood industries are a crucial part of Indiana’s Agricultural economy. For better understanding, we have updated their economic contribution to the state economy with 2019 data (the most current data). The businesses were categorized by primary industries, including logging and limited manufacturing; secondary industries, which convert raw materials or minimally processed products into finished products suitable for commercial and residential usage; and tertiary industries supporting related economic activities or employ hardwood products in their final products. Other industries are suppliers, providing tools and equipment to hardwood-related businesses and paper manufacturers. Using the Impact Analysis for Planning (IMPLAN) database, we employed an input-output model that tracks the flow of goods and services between industries in dollar amounts.
We assessed the contribution across three categories. Direct contributions, which detail the first sums invested by Indiana’s hardwood industries. Indirect contributions, which measure business-to-business transactions, excluding the initial round of spending. Induced contributions, which are the outcomes of employees’ expenditure of money they earn from working in these sectors.
The total economic contribution of hardwood industries to Indiana’s economy in 2019 was about $24.6 billion, including roughly $15.4 billion of direct output. The primary, secondary, and tertiary industries contributed $3.5 billion of added value to Indiana. However, when accounting for indirect and induced value addition, this amount rose to $6.6 billion. In addition, supporting sectors, like suppliers and paper manufacturing industries, contributed $1.5 billion in direct value, combined with indirect and induced value, totaling around $3.3 billion. Altogether, the hardwood industries contributed $9.9 billion in value-added to the state economy.
Indiana’s hardwood industries directly employed about 63,000 people in Indiana and indirectly supported 53,000 jobs (Figure 1). Secondary industries were the largest employers, providing nearly 28,000 direct employment while supporting 21,000 jobs. In addition, hardwood industries paid about $4 billion as direct employee compensation in 2019, ranging from $55,000 to $83,000, with an average of $67,000.
This report provides an overview of the 2019 Indiana hardwood industry’s performance in terms of output and employment. We intend to publish the full description of our findings by the end of 2022.
Methods to Detect Forest Carbon Change
By Bowen Li, M.S. Student
With increased observations of extreme weathers and natural disasters in recent years, there is a rising attention to climate change from the public. The main driver of climate change is greenhouse gases, which include carbon dioxide, methane, nitrous oxide, and other fluorinated gases. Carbon dioxide is the major greenhouse gas that impacts temperature regulation, but it has been excessively emitted into the atmosphere by humans. In 2020, 76% of U.S. greenhouse gas emissions come from transportation (27%), electric power (25%), and industry (24%) (EPA 2020).
Forests are a major contributor in carbon sequestration. Via photosynthesis, trees absorb CO2 from the atmosphere and convert it into glucose. In other words, this process let carbon from CO2 stored inside of trees. However, how do we know the amount of carbon stored in a forest? How would a forest management activity influence carbon storage? Does it emit more carbon than doing nothing, or does it actually promote carbon stocking on a long term? Quantification analysis of carbon storage is very useful in answering such questions. There are many ways to do this, but today we will introduce three of them.
Destructive sampling is one of the most accurate methods to estimate carbon on individual trees. You can cut down a tree, dry it and measure its weight, then you will know the amount of carbon for that particular tree. However, it would be very time-consuming and labor-intensive to do this for an entire forest. Also, it’s not practical to cut down every single tree just to estimate carbon.
Another common practice also involves field data collection, which typically records tree species, diameter, and/or tree height. For each tree species (or species group), an allometric equation is built to relate diameter (and/or height) with its volume which eventually converts to carbon. This practice is easier than the first one, but it also has limitations. It assumes all tree conditions within a forest are the same. The real circumstance, however, is more complicated. Even just for a same species, growth may still differ as a result of varying climate, soil conditions, topography, and light conditions. Besides, such field data collection still takes plenty of time.
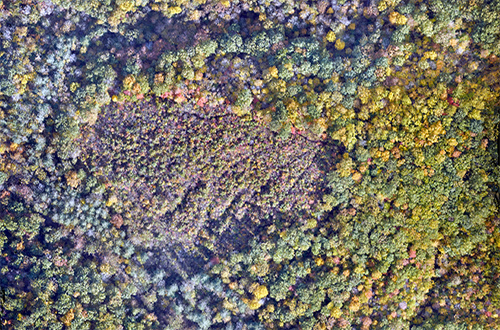
The most efficient method to estimate carbon is remote sensing. It uses aerial images to capture forest change within a short period of time. Depending on the resolution of images, from centimeters to kilometers, the level of details varies and is suitable for different areal coverage. A resolution of several kilometers may satisfy a state-level investigation, but a forest like Martell may need a sub-meter resolution for differentiating tree crowns (Fig.1).
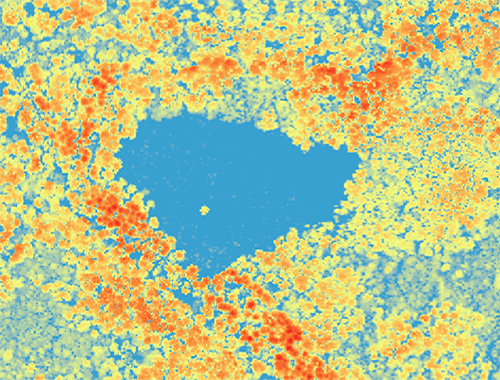
Different sources of remote sensing data also provide various information of a forest. For example, Lidar (also called “Light detection and ranging”) data provides tree height information (Fig.2), whereas images obtained from a camera plus a near-infrared sensor may provide forest health information. Then, similar to the second method, the extraction and integration of such information can be used to relate with forest biomass which eventually converts to carbon. Nonetheless, this method also has its limitations. An example of an external limitation is weather. Cloudy days are not a good time to collect images as trees can be blocked by clouds casted by shadow. Also, images taken during the growing season are usually more useful than those from the leaf-off season. Besides, as mentioned above, the availability of image resolution may also influence the accuracy of carbon estimation. Furthermore, the selection of variables, appropriate algorithms, and ways to integrate all these information together might be challenging. More research is needed to solve such issues.
References:
Inventory of U.S. Greenhouse Gas Emissions and Sinks
Lu, Chen, Q., Wang, G., Liu, L., Li, G., & Moran, E. (2016). A survey of remote sensing-based aboveground biomass estimation methods in forest ecosystems. International Journal of Digital Earth, 9(1), 63–105.
Perceptions of Land Managers Towards Using Hybrid and Genetically Modified Trees
By Andrea N. Brennan, Zhao Ma, Professor Forestry & Natural Resources & Douglass F. Jacobs, Fred M. van Eck Professor of Forest Biology
From New Forests (2021) Hybridization and genetic modification are potential methods for incorporation of stress tolerance being explored to support some at-risk tree species. However, many concerns, both ecological and economic, have been identified in using these biotechnologies, such as potential for invasiveness or high cost. There is limited information on perceptions towards hybrid and genetically modified (GM) trees, particularly from individuals responsible for widescale tree management. An online survey was administered to land managers in Indiana, USA to gauge perceptions to hybrid and GM trees, and current hybrid tree use. Land managers had stronger concern for ecological, rather than economic, issues, with potential for invasiveness being strongest. Agreement was highest for using the tree types for conservation and restoration of at-risk species and production purposes. However, perceptions varied by characteristics such as concern type, age, and land type managed. Ecological concern and land type managed most strongly predicted hybrid use.
Overall, the majority of land managers agreed, rather than disagreed, with a variety of potential hybrid and GM tree advantages and purposes. Thus, results indicate that if these biotechnologies are deemed appropriate for supporting at-risk species, the majority of land managers in Indiana might be agreeable to such recommendations from researchers. However, it was also clear that despite this, most respondents concurrently had strong ecological concerns about suitability as a native species replacement. To address this, it is essential that these tree types be thoroughly vetted, and land managers be actively engaged in the process, as this population would ultimately be responsible for any widescale implementation of hybrid and GM trees.
Brennan, A.N., Ma, Z. & Jacobs, D.F. Perceptions of land managers towards using hybrid and genetically modified trees. New Forests (2021).
Download full article, Perceptions of land managers towards using hybrid and genetically modified trees.
Grant will Fund Family Forest Carbon Program in Nine States
Purdue University has received $12 million of a $35 million project led by the American Forest Foundation and funded by the U.S. Department of Agriculture’s Partnership for Climate Smart Commodities to help family forest owners practice climate-smart forestry in Indiana and eight other states throughout the eastern half of the U.S.
The project’s other partners are The Nature Conservancy, the Center for Heirs Property Preservation, and Women Owning Woodlands. The project could sequester an estimated 4.9 million tons of atmospheric carbon—a greenhouse gas that affects climate—over a 20- to 30-year period.
“Our digital forestry group has been working on various tools and thinking about how to apply these tools to real-life problems,” said Songlin Fei, who directs Purdue’s Integrated Digital Forestry Initiative. “This is an opportunity to apply our expertise to solving part of the climate-change puzzle.” Purdue’s cross-disciplinary Integrated Digital Forestry Initiative includes faculty members from the colleges of Agriculture, Engineering, Sciences, Liberal Arts and Libraries and the Polytechnic Institute.
The Integrated Digital Forestry Initiative, one of the five strategic investments in Purdue’s Next Moves, leverages digital technology and multidisciplinary expertise to measure, monitor and manage urban and rural forests to maximize social, economic and ecological benefits. “We’re bringing a traditional field into the digital age,” said Fei, professor, Forestry and Natural Resources, and Dean’s Chair of Remote Sensing.
The project partners aim to enroll 1,600 landowners, who control a total of over 160,000 acres—about 250 square miles—of family forests, into the Family Forest Carbon Program (FFCP), which was developed by the American Forest Foundation and The Nature Conservancy. The foundation and the conservancy will make special efforts to recruit rural, minority and women forest landowners in collaboration with the Center for Heirs Property Preservation and Women Owning Woodlands.
The FFCP already operates in a dozen states in the upper Midwest and the Northeast. The USDA grant will bring nine more states into the FFCP: Indiana, Ohio, Kentucky, Tennessee, Virginia, North Carolina, South Carolina, Georgia and Alabama. In several states, such as Indiana, hardwood-related commodities contribute significantly to the economy.
“This grant allows us to combat climate change, put technology into the hands of forest landowners, and engage underserved and rural Americans,” Fei said.
For full article view: Purdue College of Agriculture news, Purdue to boost climate-smart forestry practices among private landowners
The Indiana Forest Product Price Report: History and Outlook
By Bill Hoover, Professor Emeritus of Forest Economics and Mo Zhou, Associate Professor of Forest Economics and Management
The Indiana forest products price report represents the nation’s longest-running and most detailed information on prices paid for delivered hardwood logs. It has been published in some form from as early as 1934. Many other states started similar reports later. Initially, the report was related to stumpage to increase the efficiency of the timber market, a purpose now served by the Indiana consulting forester stumpage price report.
The Indiana forest product price report has been used primarily for the trend analyses needed to evaluate investing capital in the acquisition and long-term management of hardwood timber stands. The reports for the last 20 years or so are accessed online by individuals and firms from all over the world, U.S. Forest Service-Southern Research Station Timber Price Information. A digital repository of the historical prices dated back to 1957 along with some tools for understanding and utilizing the information is available at www.foresteconomics.info , established and maintained by Dr. Mo Zhou, Associate Professor of Forest Economics and Management of Purdue’s Department of Forestry & Natural Resources (FNR).
The author of the price report is unknown from 1934 to 1936. Roy Brundage, Purdue Extension Forester, took over the survey and report in 1938. He published it occasionally during WWII, then continuously from 1954 to 1970, with the survey assisted by the Indiana Office of USDA Agricultural Statistics Service. It was not published from 1971 to 1975 due to Roy’s retirement. Dr. William Hoover, FNR’s Emeritus Professor of Forest Economics, published it from 1976 until his retirement in 2013 after which the IDNR Division of Forestry took over. It ceased publication in 2021 due to insufficient responses to the survey.
Given the pivotal role the price report plays in securing the long-term supply of Hoosiers’ hardwood resources, Purdue’s FNR has stepped in to revive the report. Starting in 2023, Dr. Mo Zhou plans to resume the price survey and publish one report annually. To boost the response rate of the price survey, efforts are currently underway to establish support from the primary lumber and veneer industry. The sampling pool will be increased to cover producers of different sizes across the State. FNR’s undergraduate students will be working side by side with Dr. Zhou to reach out to and engage producers. The report is expected to remain in the format of the previous reports for data consistency while adding a component detailing the yearly economic impacts of the hardwood industry within the State. The existing digital repository will be upgraded to include timberland valuation and management tools to help stakeholders make better use of the information in the report.
An online questionnaire will soon be distributed to producers, landowners, and other stakeholders to understand what additional information they would like to see in the price report. The first batch of appeal letters to the price survey respondents is expected to be sent out in early 2023, followed by a price survey in spring. For any questions, comments, and suggestions regarding the price survey, please contact Dr. Mo Zhou via email (mozhou@purdue.edu) or phone (765-493-3098).
A Vision for Digital Forestry
The digital forestry initiative, which involves faculty from six Purdue colleges, envisions using remote sensing to measure and monitor every tree on the planet to maximize social, economic and ecological benefits. Activity is occurring in four major areas toward this goal.
– Automated measurement
– Proactive monitoring for forest health
– Precision management to make forests more productive
– Educating the workforce, starting by putting technologies into our students’ hands
Within those areas, the following tools featured in this section are in various stages of development:
 eForester
A smart-phone app that can identify tree species, measure diameter and volume, and economic and environmental values.
StemMapper
A professional-grade inventory system with high precision and the capability to produce digital twins — a virtual representation of real-world forests.
HealthMapper
An early warning system that uses technology to monitor and proactively detect forest diseases, disturbances and fires.
Forest Engine
An online tool that makes the digital forestry database and dashboard widely available. This online dashboard has the potential to provide regional coverage for improved planning and management of forests and forest resources.
To learn more, visit the website at https://ag.purdue.edu/digital-forestry/.
Reprinted from Purdue University College of Agriculture Plant Sciences 2.0 Newsletter.
Paying Your Respects
By Dr. Shaneka Lawson, USDA Forest Service, Research Plant Physiologist
On September 11, 2001, our nation was faced with one of the most devastating attacks to happen on American soil since the bombing of Pearl Harbor. No one knew 3,000 lives would be lost in the aftermath, many of them First Responders, when a plane hit the World Trade Center in New York City. Dr. Shaneka Lawson, a frequent visitor to the World Trade Center Memorial whenever in New York and happens to have a birthday on 9/11, went the extra mile this year to pay her respects.
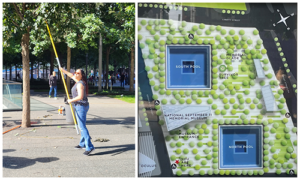
On September 10, 2022, Dr. Lawson helped prune the 400 Swamp White Oak trees planted in the World Trade Center Memorial Gardens after obtaining permission from the Security Team surrounding the site and the Crew Supervisor (Figure 1). This led other visitors who were watching the activities with interest to volunteer their services as well. The Memorial was being shut down the next day for a private remembrance event with family, friends, and relatives of those who lost their lives during the 2001 events as the guests of honor.
This volunteer effort was a small contribution by Dr. Lawson but moved site caretakers to the point that she was issued a standing invitation to come back again. As a parting gift, she received acorns from the “Survivor Tree”, the only tree to survive the events of September 11, 2001.
Lawson Wins National Award
The 2022 Women of Color (WOC) STEM DTX (Digital Technology) Conference was an exciting experience for Dr. Shaneka Lawson and marked the first time a USDA R&D employee earned an award at this prestigious event. These awards are exclusive and boast a stringent selection process to identify awardees. Award recipients are chosen from a talented pool of mid-career professionals and managers, C-suite executives, innovators, and inventors. This event is designed to celebrate and promote significant achievement in science, technology, engineering and mathematics professional careers.
 Nominated by Drs. Keith Woeste and Ralph Crawford (Asst. Deputy Chief for DEIA), and Forest Service Deputy Director Tracy Tophooven, Dr. Lawson earned the Outstanding Achievement Award for Technology in STEM. Specifically, she was named a Technology Rising Star. Rising Stars are young women, with 21 years or less in the workforce, who are helping to shape technology for the future. Shaneka was honored at a special recognition event during the Women of Color STEM Conference in Detroit, Michigan for her accomplishments using mixed media presentations as a delivery method to share scientific topics with audiences of all ages.
The event was sponsored by Amazon, Apple, Boeing, Lockheed Martin, NASA, NOAA, and many other entities. The event sponsor was the Career Communications Group, Inc. (CCG). CCG has been working with top global corporations and government organizations for over 30 years helping them find, develop, and retain top minorities with the needed technology skills.
Dr. Shaneka Lawson Awarded the 2022 Presidential Safety Award
 The Presidential Safety Award is awarded to individuals or groups that have made significant accomplishment in improving safety at Purdue University. In the disruptions following the pandemic, awardees for 2020 – 2022 were not named. This year, to make up for lost time, deliberations by the Environmental Health and Safety (EHS) Award Committee led to Dr. Shaneka Lawson being awarded the 2022 Presidential Safety Award. Awardees for 2020 and 2021 were also awarded this year. Shaneka was nominated by Kristi Evans, Purdue University Occupational Safety Specialist, and received final approval by Senior Director of EHS, Eric Butt. With her excellent safety record, personal leadership in safety, and exceptional organization within the lab, Shaneka was the natural choice for this year’s award winner.
Janis Gosewehr Retires
 Administrative assistant Janis Gosewehr retired in December 2022 after 33 years with Purdue University, 22 years with the HTIRC. Since the beginning, Janis worked alongside Purdue and USDA Forest Service researchers and students to assist all staff to meet their research goals. She supported the center through her work to prepare and host events such as the annual advisory committee, maintained the HTIRC.org website, the biannual newsletter, and many other tasks. Janis was especially fond of meeting and working with students and is proud to continue to keep in touch with many alumni. We wish Janis well as she starts her next chapter!
White Oak Initiative Introduces the Landowners for Oaks Series
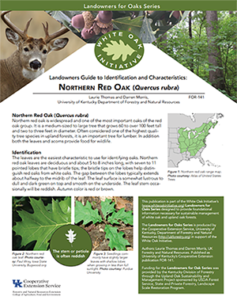 The White Oak Initiative – Landowners for Oaks Series is now available! This series, made up of 11 publications, is geared toward landowners engaged in upland oak management with a focus on white oak. Three of the publications provide information on the importance of oaks, their biology, and an overview of common management practices to enhance oak regeneration and growth. Eight publications provide landowners with basic information on common upland oak species, how to identify them and important management and utilization information. All factsheets in the series are available for download at forestry.ca.uky.edu/woi.
The topics in the series:
Landowners for Oaks Series
– Landowners Guide to – Challenges of Upland Oak Regeneration (pdf)
– Landowners Guide to – Sustainable Oak Management Practices (pdf)
– Landowners Guide to – Understanding the Importance of White Oak (pdf)
Landowners Guide to Identification and Characteristics Series:
– Landowners Guide to Identification and Characteristics – Black Oak (pdf)
– Landowners Guide to Identification and Characteristics – Chestnut Oak (pdf)
– Landowners Guide to Identification and Characteristics – Chinkapin Oak (pdf)
– Landowners Guide to Identification and Characteristics – Northern Red Oak (pdf)
– Landowners Guide to Identification and Characteristics – Post Oak (pdf)
– Landowners Guide to Identification and Characteristics – Scarlet Oak (pdf)
– Landowners Guide to Identification and Characteristics – Southern Red Oak (pdf)
– Landowners Guide to Identification and Characteristics – White Oak (pdf)
Chestnut Oak Decline in Southern Indiana
By Cameron Dow, Michael Jenkins, Michael Saunders, James Jacobs
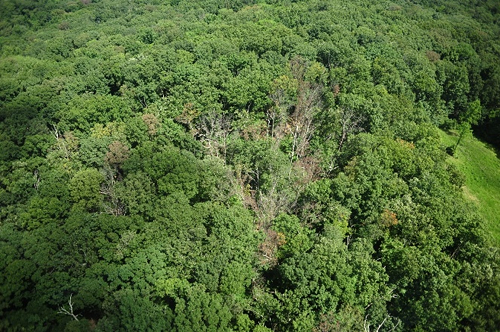
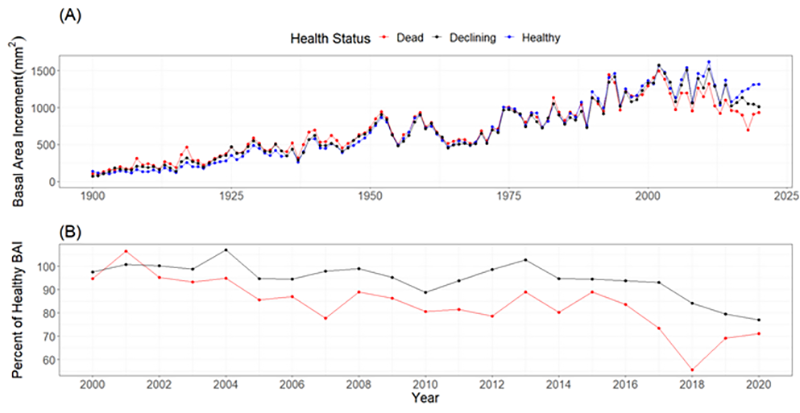
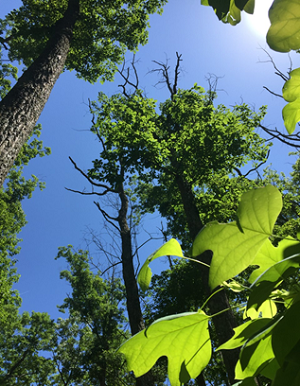
In 2016, the Indiana Department of Natural Resources (INDR) noted an unusually high amount of chestnut oak mortality in southern Indiana. Since then, a large number of additional mature chestnut oak trees have died (Figure 1). In 2021, INDR partnered with Purdue University and USDA-Forest Service Eastern Region Forest Health Protection to investigate the cause of ongoing mortality.
Initially, managers were concerned that this mortality was associated with an outbreak of the pathogen Phytophthora cinnamomi, commonly known to cause root disease. Trees within Morgan-Monroe State Forest, Yellowwood State Forest, and the Hoosier National Forest were tested for the pathogen, but only one sample out of thirty returned positive, indicating that the pathogen was likely not driving the observed mortality. Next, we used tree rings from healthy, declining, and dead trees (Figure 2) to search for evidence that drought or other climate events incited decline. Chestnut oak is considered one of the most drought tolerant of the oak species, and drought induced declines have been rarely documented in the past.
We measured the ring widths of tree cores from 258 dead, declining, and healthy chestnut oak trees across southern Indiana, then averaged these ring widths together based on their health status (healthy, declining, and dead) to examine how growth in each category responded to past climate (Figure 3). We clearly saw that trees which were impacted by decline grew at a greater rate through most of the last century than trees that remained healthy (Figure 3a). Greater radial growth rates such as these often signal that the trees focused more resources toward stem growth, at the expense of root growth. However, this prioritization of stem growth at expense of root growth predisposes them to greater damage during drought. Indeed, we saw that growth rates in declining and dead trees decreased and failed to recover as quickly as that of healthy trees following the droughts of 2005, 2007, and the exceptional drought of 2012 (Figure 3b). In fact, the drought which ultimately pushed the dead and declining trees into their decline spirals was likely the drought of 2012.
Mortality rates of chestnut oak were highest on north and northeast facing slopes, which offer the most mesic (moist) conditions, but rates were moderately high on other aspects as well. Tree position along the slope seemed to be less important with mortality rates of trees on the ridgetop, upper slope, and mid slope positions having similar mortality rates. Generally, our results suggest that drought impacts are greatest on individual trees that prioritized above ground growth or are otherwise adapted to more mesic growing conditions. Even though chestnut oak is considered one of the most drought tolerant of the oak species, land managers should monitor chestnut oak following drought, with particular attention paid to chestnut oak sites that have been historically viewed as having more mesic and productive conditions.